


Executive Summary
This article examines how the rapid expansion of cashless payments is reshaping consumer behaviour, banking systems, and international trade in an increasingly fragmented global economy. It argues that payments have evolved from a largely invisible back-office function into a strategic layer of digital infrastructure that influences market power, financial inclusion, and economic sovereignty. Drawing on evidence from McKinsey, GSMA, and studies of Kenya and India, the article highlights the rise of mobile wallets, account-to-account (A2A) transfers, regional payment networks, stablecoins, and AI-enabled commerce. It demonstrates that while cashless systems can expand access to financial services and improve efficiency, their benefits remain uneven across countries, users, and institutions.
The analysis shows that banks face both opportunities and challenges. New payment ecosystems create possibilities for innovation, customer engagement, and value-added services, yet they also threaten traditional sources of fee income and intensify competition from fintech firms and alternative payment rails. The article concludes that value is increasingly shifting from the movement of money itself to the services, data, and customer relationships surrounding payments, requiring banks and policymakers to adopt more adaptive, inclusive, and strategically informed responses.
1.0 Introduction
Cash is losing ground worldwide, but unevenly, and the money it leaves behind is reshaping banking. Payments are no longer a neutral pipe; they influence who earns, who is included and who controls financial flows. While the decline of cash is widely recognised, subtler dynamics beneath it warrant closer examination. McKinsey’s 2025 Global Payments Report finds cash at 46% of worldwide payments, down from 50% in 2023, while digital wallets carry about 30% of global point-of-sale volume, led by India, Brazil and Nigeria. The industry earned $2.5 trillion in 2024 from 3.6 trillion transactions, and cross-border flows alone reached roughly $190 trillion.
For banks the shift is double-edged. Payments remain the most valuable part of financial services, with an average return on equity of 18.9%. Yet interest income made up 46% of revenue, a cushion that thins as rates fall, and consumers are moving to lower-yield rails. This article draws on McKinsey’s global and cross-border reports, supplemented by GSMA, academic and Indian data on mobile wallets.
2.0 The global rise of cashless payments and its historical legacy
Cashless payment spread fastest where bank branches were scarce. Mobile money Cashless payments spread especially rapidly where conventional banking infrastructure was limited. Mobile money requires a phone and a local agent rather than a traditional bank account, allowing many low-income economies to leapfrog the branch-and-card model. According to the GSMA, mobile money reached 2.3 billion registered accounts in 2025, with 593 million active monthly users and more than $2 trillion in annual transaction value. It took 20 years for the industry to reach $1 trillion in annual transactions and just four more years to double that figure. Africa accounts for about 1.2 billion registered mobile money accounts. However, nearly three-quarters of registered accounts are inactive in a given month, while fraud and transaction taxes can push some users back to cash. Adoption therefore remains uneven across countries, demographic groups and patterns of use.
M-Pesa and the “leapfrog” effect in Kenya
Safaricom launched M-Pesa in 2007. By the mid-2010s Kenya had about 2,700 ATMs but 110,000 M-Pesa agents, and 96% of households used the service. Suri and Jack estimate that mobile money lifted 194,000 households (2%) out of poverty and moved 185,000 women from subsistence farming into business. Its mechanism was cheap, instant remittances: households hit by a shock typically cut consumption by about 7%, while M-Pesa users did not. Few countries have matched this, because the result owed much to one dominant operator and a dense agent network.
Demonetisation and India’s UPI moment
In India the catalyst was a policy shock. In November 2016 the government voided 500 and 1,000 rupee notes, and the value of banknotes in circulation fell 20.2% by March 2017. The state-backed Unified Payments Interface (UPI), launched in August 2016, absorbed the demand: annual volume rose from 17.8 million transactions in FY17 to 241.6 billion in FY26, reaching 23.66 billion in July 2026 alone. The caveat is that digital did not replace cash; currency in circulation has more than doubled since the note ban and is back to its pre-2016 share of GDP.
Where payments earn money
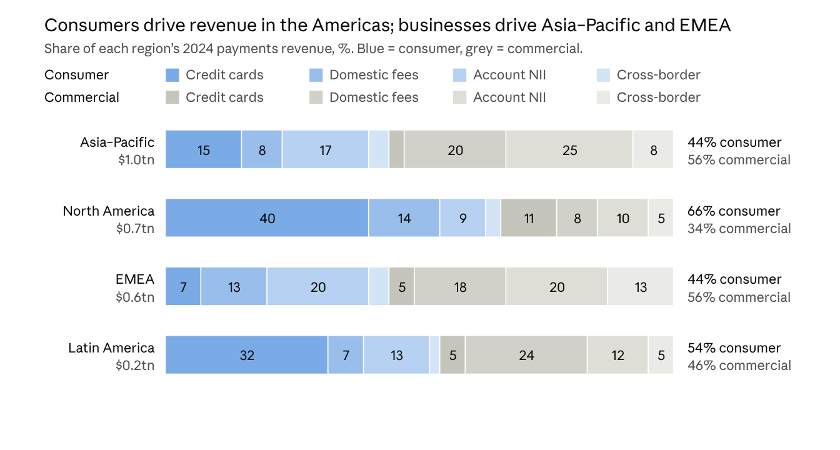
Figure 1: Global payments revenue by type and region, 2024 (% of each region’s revenue); source: McKinsey Global Payments Report 2025, Exhibit 2. Segment order inferred from the report text.
Figure 1 shows each region’s 2024 revenue pool (Asia–Pacific $1.0 trillion, North America $0.7 trillion, EMEA $0.6 trillion, Latin America $0.2 trillion), split into consumer revenue (51% globally) and commercial revenue (49%), then into cards, domestic fees, net interest income (NII) and cross-border services. It shows where payments earn money, not where cashless volume is highest; the two differ. Subtotals are my sums of the exhibit’s segments.
Three patterns stand out. Asia–Pacific and EMEA are commercially driven (about 56% each), and deposit income is the largest single line in Asia–Pacific at 25%. North America is consumer-driven (about 66%) because credit cards generate roughly half of regional revenue, and Latin America leans the same way. This card dependence is the exposure: where wallets and A2A rails spread, as in India or Brazil, interchange income is most vulnerable. Wallet-led Asia–Pacific monetises through deposits, yet its revenue still fell 1% in 2024 while the global total grew 4%.
3.0 Forces currently reshaping global payments
Revenue growth is slowing while the system fragments. Global payments revenue grew 7% a year from 2019 to 2024, but growth fell to 4% in 2024 from 12% in 2023 as rates peaked and volume moved to lower-yield methods. Regions diverged: Latin America grew 11%, EMEA 8%, North America 5%, and Asia–Pacific shrank 1%. McKinsey’s baseline is 4% a year to 2029, reaching $3.0 trillion.
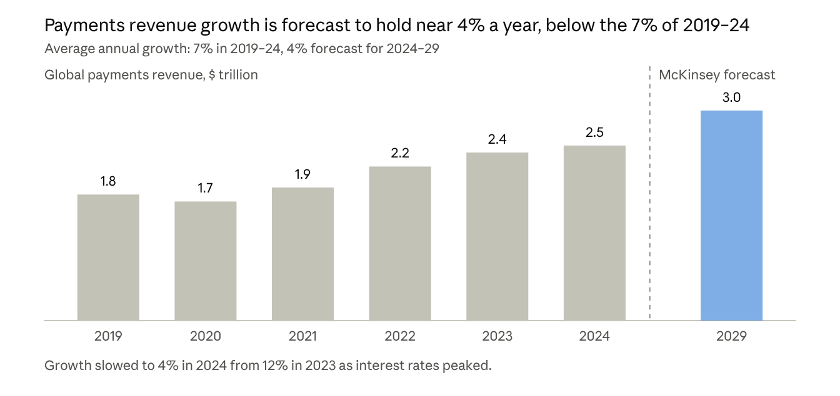
Figure 2: Global payments revenue, $ trillion, 2019–2024 and 2029 forecast; source: McKinsey Global Payments Report 2025, Exhibit 1.
Fragmentation and regionalisation. Sanctions pushed Russia onto its Mir card, the European Central Bank promotes Europe-focused systems, and overlays such as Pix, Bizum and UPI are interconnecting across borders. McKinsey sketches two futures: a multirail system with global “passkeys”, or escalating localisation that erodes global standards.
Stablecoins. Issuance has doubled since early 2024 and rules are clarifying in major markets, but daily volume of about $30 billion remains a fraction of global flows.
Artificial intelligence. Most use so far cuts costs in fraud, routing and reconciliation. Agentic commerce is nascent: 10% of consumers use AI to start shopping, and 20% would let it buy for them.
4.0 The future of payment methods
The likeliest future is multirail: cards, wallets, A2A transfers and stablecoins side by side, with software choosing the rail. McKinsey expects intelligent agents to pressure interchange revenue and yield spreads. Evidence from developing markets suggests usage is deepening: the GSMA reports that mobile money value grew 23% in 2025, faster than volume at 16%, for the first time in four years. Three conundrums sit beneath this picture.
Who pays for “free” rails? Low-cost A2A and wallet payments erode fee income. Banks are beginning to charge payment aggregators for UPI merchant transactions, a possible template for new fee models, but policymakers must balance low consumer prices against the sustainability of the infrastructure.
Sovereignty versus interoperability. Countries want domestic control, yet 24% of mobile money providers say cross-border data rules have hindered their operations, and local schemes favour local players.
Deposits versus digital money. If customers held balances in stablecoins rather than using them as a bridge between currencies, bank deposit funding and revenue models would be disrupted.
McKinsey advises firms to treat interoperability as infrastructure and to earn trust before agents mediate the relationship. The framing deserves some scepticism, as it describes a world in which complexity benefits those who sell integration and advice.
5.0 Implications for international trade and money transfer
Cross-border payments are large, stable and nearing commoditisation. In 2025 about $191 trillion crossed borders, generating $293 billion in revenue, expected to grow about 4% a year. Figure 3 shows the imbalance: business-to-business (B2B) payments are 97% of flows but 53% of revenue, at a margin of just 0.1%, whereas consumer-linked flows (C2B, B2C and C2C) are about 3% of volume yet 47% of revenue. The fastest-growing flows are B2C (9% a year) and C2B (8%).
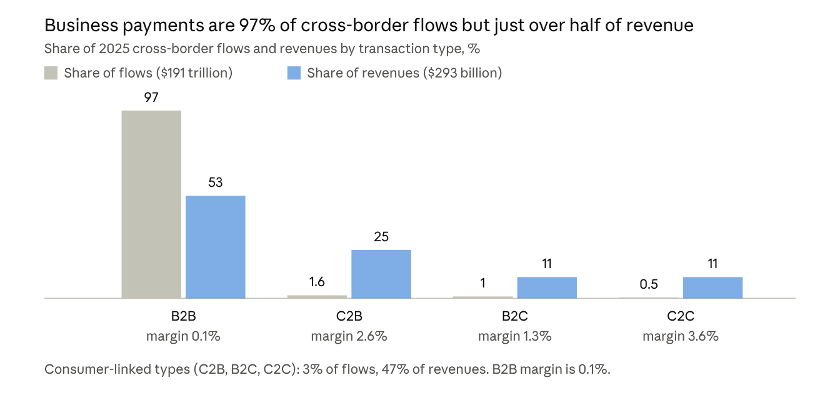
Figure 3: Cross-border flows versus revenues by transaction type, 2025 (% of total); source: McKinsey cross-border payments article (August 2026), Exhibit 1.
That concentration explains the price war. World Bank data cited by McKinsey show the average cost of sending $200 fell only from 6.8% in 2019 to 6.3% in 2025, though digital-only channels are below 5% and the best corridors meet the UN’s 3% target. Fintechs now hold about 53% of retail value and 20% of SME value, but remain marginal in corporate flows (Figure 4).
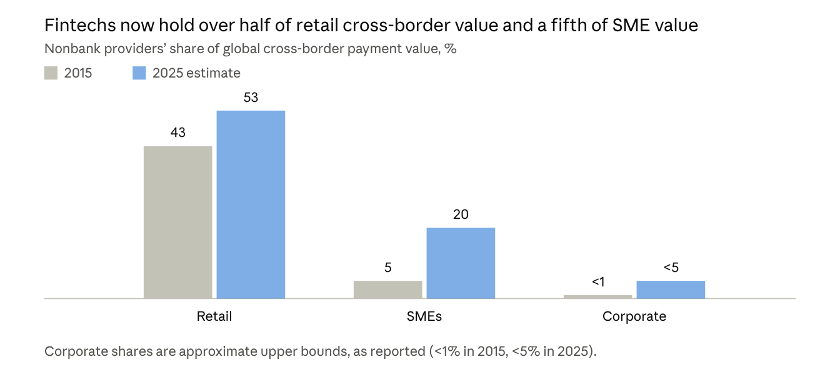
Figure 4: Nonbank (fintech) share of cross-border payment value, % by customer segment; source: McKinsey cross-border payments article (August 2026), Exhibit 2. 2025 values are estimates.
Speed and low cost are becoming table stakes, with initiatives such as Project Nexus, Buna and a Swift retail scheme. The harder problem for exporters is volatility. Midsize firms therefore need hedging, liquidity and cash-flow tools, not just cheaper transfers, and more than 80 countries now mandate e-invoicing, pulling payments into accounting software.
Strategically, McKinsey sees payments becoming a feature rather than a product, leaving fintechs to become operations platforms, transaction banks, niche specialists or rail orchestrators, and banks to own the customer relationship or lose operational deposits. A critical caveat is that remittance costs of about 6% remain well above the 3% goal, so the benefits of competition are uneven, strongest in rich G7 corridors.
6.0 Conclusion
In conclusion, cashless payment is now mainstream, but it is not one story. It grew from missing bank infrastructure in Kenya, from a policy shock and a public rail in India, and from cheaper alternatives to cards in rich markets. The common thread is that value is migrating from moving money towards the services and balances around it, a shift that is both enabling and constraining. For banks, it means defending deposits and customer relationships rather than transaction fees; for policymakers, it means weighing sovereignty, low prices, stability, and inclusion at once.
Reference:
- External sources were taken from search results, not read in full.
- McKinsey & Company (September 2025), The 2025 McKinsey Global Payments Report: Competing systems, contested outcomes.
- Zell, J. and Anckaert, L., McKinsey & Company (August 2026), Cross-border payments: Out of the commodity trap, into the future.
- GSMA (March 2026), State of the Industry Report on Mobile Money 2026, press release.
- Suri, T. and Jack, W. (2016), The long-run poverty and gender impacts of mobile money, Science 354(6317).
- PYMNTS (2021), Banknotes, Digital Payments up in India Five Years After Demonetization.
- BusinessWorld, Despite being leader in digital transactions, cash circulation increasing in India.
- Business Standard (November 2026), Ten years after note ban, how India’s cash habit survived the UPI boom.
- Deccan Herald, UPI completes 10 years.
Dr Bidit L. Dey

