



Rising house prices have made housing an increasingly important source of household wealth, but they have also raised questions about who can afford to become a homeowner and how wealth is passed between generations. In England, the typical home cost 7.6 times annual full-time earnings in 2025, more than double the ratio in 1997, although affordability has improved somewhat since its peak in 2021.
Beyond these changes in affordability, research suggests that family background plays an increasingly important role in access to homeownership. Among adults aged 25 to 39, the homeownership gap between those whose parents owned their homes and those whose parents rented widened from 20 to 29 percentage points between 2009 and 2019. Parental housing wealth and financial support can influence not only whether younger generations are able to buy a home, but also where they buy and how much housing wealth they accumulate. These findings raise a broader question about the role of housing in shaping economic opportunity and inequality across generations.
Housing: A Home and an Asset
Housing occupies a distinctive position in the economy. It provides shelter, security and access to employment opportunities, but it is also one of the principal assets through which households accumulate wealth. Changes in property prices therefore have consequences that extend well beyond the housing market.
For existing homeowners, rising property values can increase housing equity and strengthen household balance sheets. For prospective buyers, however, those same increases can raise deposit requirements and make entry into homeownership more difficult. Housing price appreciation can consequently affect households differently depending on whether they already own property.
These differences raise an important economic question: to what extent has housing become a mechanism through which existing wealth influences future opportunities?
Recent evidence from the Office for National Statistics (ONS) and the Institute for Fiscal Studies (IFS) offers useful insights into this question. The findings suggest that while housing affordability has improved in recent years, the longer-term relationship between property ownership, family wealth and economic opportunity remains significant.
The Long-Term Evolution of Housing Affordability
One way to assess changes in housing accessibility is to compare property prices with earnings. According to the ONS, the median home sold in England in the year to September 2025 cost £300,000, while median annual earnings of full-time employees, measured by place of work, were £39,300 (ONS, 2026). This gives a house-price-to-earnings ratio of 7.6: a typical property cost about 7.6 years of gross individual earnings. For reference, the ONS uses five years of earnings as a broad indicator of affordability.
This ratio has risen substantially over the long term. In 1997 the median home cost about 3.5 times annual earnings. The ratio climbed rapidly until the mid-2000s, dipped after the 2008 financial crisis, and rose again through the 2010s, so that it has more than doubled over the period (Figure 1).
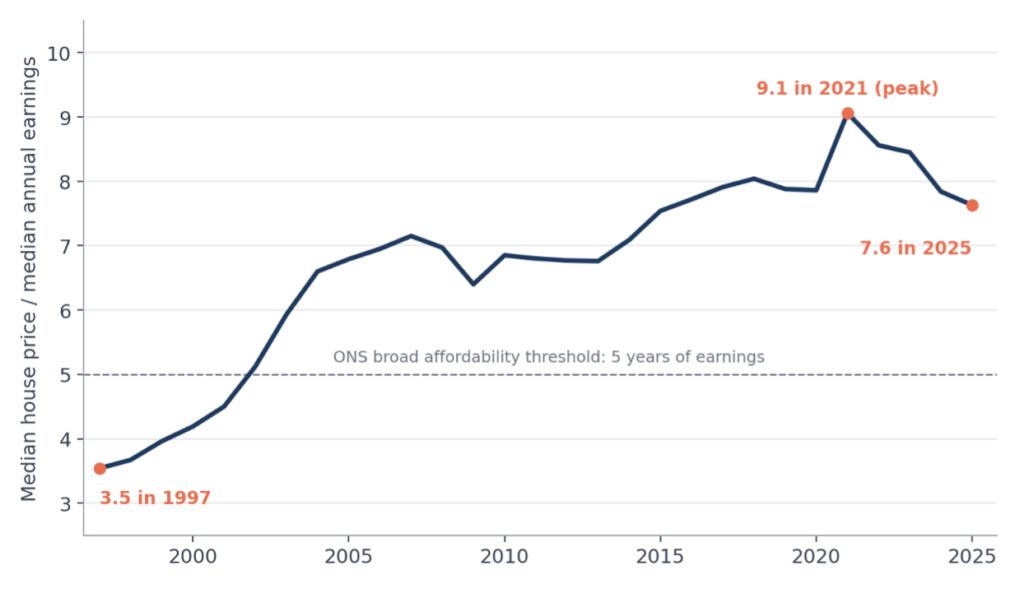
Figure 1. Housing affordability in England, 1997 to 2025. Median house price divided by median workplace-based annual earnings, England. House prices refer to the year to September. Source: ONS (2026), Housing affordability in England and Wales: 2025.
However, the evolution has not been uniform. After a peak in 2021, affordability has improved. Between 2021 and 2025, median house prices across England and Wales rose by about 5%, while median earnings rose by about 25%. England’s ratio of 7.6 in 2025 is its lowest since 2015 (ONS, 2026). Two cautions apply. The ratio is calculated in cash terms, and the ONS notes that comparisons of earnings over time are limited, because data collection was disrupted by the pandemic and estimation methods changed in 2021, 2023 and 2024.
This distinction matters. The evidence does not support a narrative of continuously worsening affordability. Instead, it points to a substantial long-term deterioration followed by a period of partial recovery.
Furthermore, the national average conceals considerable geographical differences. In 2025, London’s median ratio stood at 10.6, compared with 5.0 in the North East of England. At the extremes, the ratio was 4.1 in Hyndburn and Kingston upon Hull and 25.2 in Kensington and Chelsea (Figure 2). In London, buying an average-priced home required a further £279,000 on top of five times average earnings. Only 23 of 318 local authority areas in England and Wales (7%) had homes selling for less than five times earnings in 2025, compared with 88% in 1997.
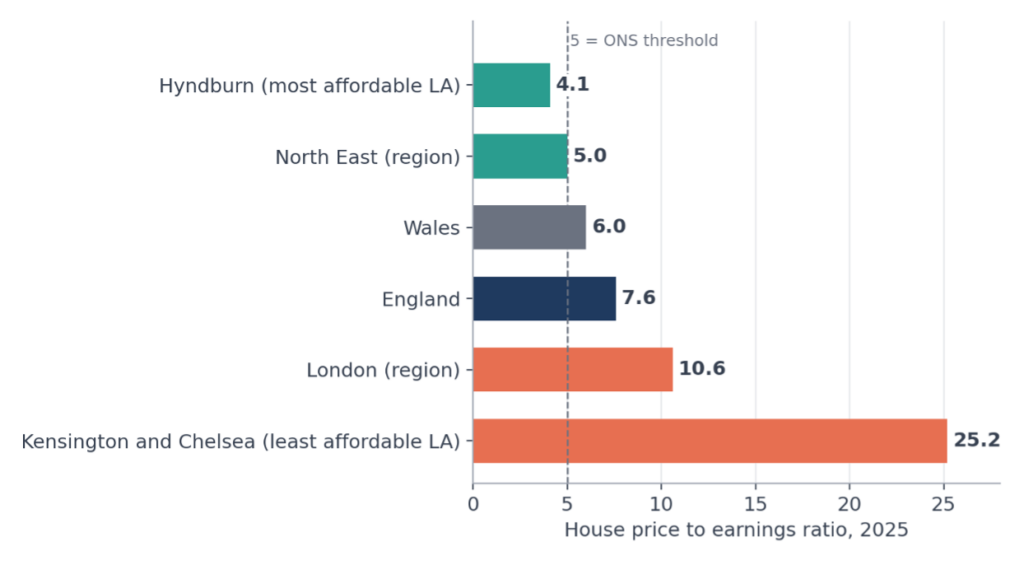
Figure 2. Housing affordability varies widely across places, 2025. Median house price divided by median workplace-based annual earnings. LA = local authority. Source: ONS (2026), Housing affordability in England and Wales: 2025.
Importantly, the price-to-earnings ratio is not a complete measure of purchasing affordability. It uses individual rather than household earnings, whereas around 60% of mortgages in early 2024 were based on joint incomes. It also cannot capture deposits, existing equity, upfront costs or ongoing mortgage payments, all of which depend on interest rates and household circumstances (ONS, 2026).
Nevertheless, the historical data reveal a structural change: acquiring housing has become more demanding relative to individual earnings than it was three decades ago.
Does Family Background Influence Homeownership?
The affordability figures describe the relationship between housing prices and earnings. They do not, however, explain why households facing similar market conditions may experience different opportunities to purchase property. To investigate this question, it is useful to examine the role of parental homeownership.
Research published by the IFS in 2023, using data from the Wealth and Assets Survey for Great Britain, compared homeownership among adults aged 25 to 39 according to whether their parents owned or rented their home (Boileau and Sturrock, 2023). Overall homeownership in this age group fell from 55% in 2009 to 43% in 2019, but the decline was far from even (Figure 3).
In 2009, 60% of adults in this age group whose parents were homeowners owned property themselves, compared with 40% of those whose parents rented. By 2019, ownership among children of homeowners had declined to 51%, while the rate among children of renters had fallen to just 22%.
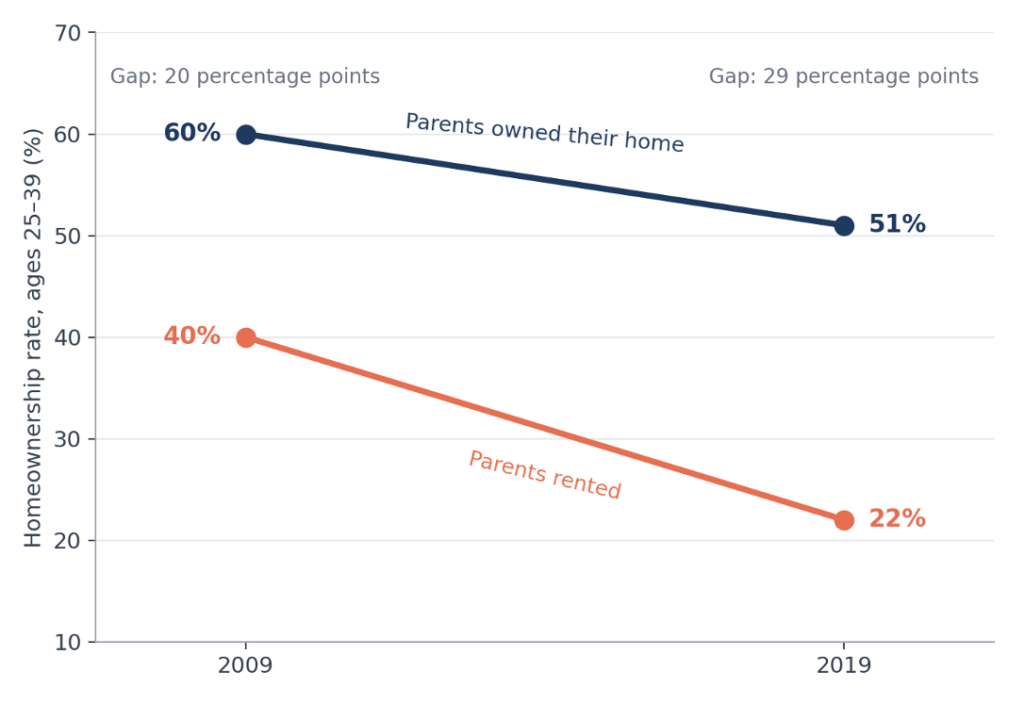
Figure 3. Homeownership among adults aged 25 to 39, by parental housing tenure, Great Britain, 2009 and 2019. Start and end points of the series shown in Figure 1 of the IFS report. Source: Boileau and Sturrock (2023), IFS, based on the Wealth and Assets Survey.
The gap widened from 20 percentage points in 2009 to 29 percentage points in 2019. By the end of the period, adults whose parents owned their homes were more than twice as likely to own property themselves.
This association should not automatically be interpreted as causal. Parental homeownership is correlated with other characteristics, including education, income, location and accumulated savings, which can also influence housing outcomes. Nevertheless, the findings highlight an important dimension of housing inequality: access to ownership depends not only on current earnings but potentially also on the resources available within the wider family.
How Housing Wealth Is Transmitted Across Generations
Financial transfers provide one mechanism through which parental wealth can influence housing access. The IFS found that in 2018 to 2020 a quarter of first-time buyers, and almost half (45%) of those in their twenties, received financial help to buy, overwhelmingly from their parents. Among first-time buyers who received help, the average amount was around £25,000, set against an average deposit of about £55,000 (Boileau and Sturrock, 2023).
Such transfers can help households meet deposit requirements, obtain mortgage financing or purchase homes earlier than would otherwise be possible. For buyers constrained by the size of their deposit, the effect is magnified: for almost two-thirds of first-time buyers, each £1,000 received from parents raised the value of the house they could buy by about £10,000, because lenders typically require a 10% deposit.
However, access to this support is uneven. More than half of first-time buyers with university-educated, homeowning parents received a transfer, with an average of around £35,000. Among those whose parents rented, 29% received help, averaging around £11,000. The IFS also cautions that not every transfer is decisive: around a quarter of recipients could have afforded their home without it, and financial help explains part, but not all, of the gap in homeownership between children of owners and renters.
A more recent IFS working paper by David Sturrock and Peter Levell, published in January 2026, provides further evidence on the relationship between housing wealth and intergenerational mobility. The researchers use census-linked data for England and Wales to compare people born in 1954 to 1963 with those born in 1974 to 1983, observed at ages 28 to 37, that is, before and after the great house price boom. They use geographical differences in how responsive housing supply is to demand to help isolate the effect of changing property values (Sturrock and Levell, 2026).
They estimate that, by ages 28 to 37, around 15% of differences in parental gross housing wealth are passed on as differences in children’s gross housing wealth: roughly £15,000 for every £100,000 of additional parental housing wealth. Higher local house prices, meanwhile, directly reduced young adults’ chances of owning a home.
Interestingly, the mechanism is not simply that wealthier parents make their children more likely to become homeowners. The study finds that parental housing wealth also influences where adult children live and work. Children from wealthier families are more likely to move to London and to buy there, where property prices and earnings are both high. Counterfactual simulations suggest that the house price boom doubled the intergenerational persistence of housing wealth and made living in London more concentrated among the children of the wealthy. These are model-based estimates, and should be read as indicative.
Housing wealth may therefore influence economic mobility through several channels: financial assistance, geographical relocation and access to employment opportunities. These findings suggest that the distributional effects of housing prices extend beyond the immediate distinction between owners and renters.
Who Benefits, and Who Faces Greater Constraints?
It would be misleading to divide the housing market into two homogeneous groups of winners and losers. Long-standing homeowners may experience substantial capital gains, particularly if they purchased property before major price increases. Yet these gains are not necessarily liquid, and homeowners seeking to move to a larger property may also face higher purchase costs.
Similarly, renters are not a uniform group. Some value flexibility, while others face substantial barriers to ownership despite having sufficient income to meet ongoing housing costs.
The more relevant distinction may concern the interaction between housing wealth, age, family resources and geographical opportunity. Higher property prices can increase the wealth of existing owners while raising the financial requirements faced by new entrants. Where family assistance helps overcome these requirements, differences in parental wealth may become increasingly relevant.
At the same time, declining house prices would not automatically improve outcomes for everyone. They could reduce existing homeowners’ equity, create difficulties for highly indebted borrowers and affect residential construction incentives. Housing-market changes therefore involve multiple, sometimes competing economic effects.
Implications for Housing and Economic Policy
The evidence suggests that housing affordability and wealth inequality should be examined together, while remaining analytically distinct.
Policies that increase housing supply may help reduce price pressures over time, particularly in areas where demand is strong. However, their effects depend on local conditions, infrastructure availability and the responsiveness of construction.
Measures that support first-time buyers can ease financing constraints, but their impact on prices depends partly on whether housing supply can expand in response to additional demand. They also do not help everyone equally. The IFS estimated that lowering the minimum deposit from 10% to 5% would make a local entry-level home affordable for only about 3% of renters aged 25 to 39. The benefit is concentrated where incomes are high relative to prices: 29% of renters in the North who could not afford to buy were held back by the deposit alone, compared with 9% in the South, where income limits on borrowing are the main barrier (Boileau and Sturrock, 2023).
Policies affecting taxation, rental markets and mortgage finance similarly involve trade-offs between accessibility, housing security, financial stability and incentives to invest. No single indicator can determine which approach is preferable. Evaluating policy requires evidence about its effects on prices, housing availability, household finances and distributional outcomes.
Conclusion
The UK housing market illustrates how an essential consumption good can also become a mechanism for accumulating and transmitting wealth.
Although affordability has improved since 2021, property prices remain high relative to historical earnings. Meanwhile, research indicates that parental housing wealth is associated with differences in homeownership, geographical mobility and economic opportunities among younger generations.
The central issue is therefore broader than whether house prices rise or fall. It is how housing-market outcomes influence the distribution of wealth and the opportunities available to households with different starting resources. Understanding these mechanisms is essential for evaluating housing policy, economic mobility and the long-term distributional consequences of property markets.
References
- Boileau, B. and Sturrock, D. (2023). Help onto the housing ladder: the role of intergenerational transfers. IFS Report R289. London: Institute for Fiscal Studies. https://ifs.org.uk/sites/default/files/2023-12/Help-onto-the-housing-ladder-IFS-report.pdf
- Office for National Statistics (2026). Housing affordability in England and Wales: 2025. Statistical bulletin, released 26 March 2026 (corrected 13 May 2026). https://www.ons.gov.uk/peoplepopulationandcommunity/housing/bulletins/housingaffordabilityinenglandandwales/2025
- Sturrock, D. and Levell, P. (2026). How do house prices affect social mobility. IFS Working Paper, January 2026. https://ifs.org.uk/publications/how-do-house-prices-affect-social-mobility (DOI: 10.1920/wp.ifs.2026.0226)
Joan Madia

